TL;DR:
- Office space utilisation measures how efficiently workspace is used, with a target of 75% to 85%. Combining reservation data with passive sources like sensors ensures accuracy and reduces ghost bookings. Improving utilisation leads to cost savings and better working conditions by designing flexible, responsive office layouts.
Office space utilisation is defined as the percentage of available workspace actively used over a given period, calculated as actual usage divided by total capacity, multiplied by 100. For office managers and facility executives, this metric is the clearest signal of whether your property budget is working for you or against you. The ideal target range sits between 75% and 85%. Below that threshold, you are paying for empty desks. Above it, you risk cramped conditions that erode productivity. Getting this number right is the foundation of every sound workspace decision.
Office space utilisation, known in facilities management as the workspace utilisation rate, measures how much of your available floor area is genuinely occupied during working hours. It is distinct from a simple headcount. A floor can be fully booked on paper and still sit half empty in practice.

The financial stakes are significant. True cost-per-square-foot calculations reveal overheads of up to 60% above base lease rates, covering cleaning, maintenance, utilities, and facilities management. Inefficient layouts can add a further 20–30% to those costs. That means a poorly utilised floor is not just wasted space. It is a compounding financial drain.
Office space efficiency also affects people, not just budgets. Underutilised offices feel lifeless and reduce collaboration. Overutilised ones create noise, friction, and stress. The utilisation rate is the number that tells you which problem you actually have.
The standard formula is straightforward: divide actual usage by available capacity, then multiply by 100. If 60 of your 80 desks are occupied at peak time, your utilisation rate is 75%. The challenge is that “actual usage” is harder to measure than it sounds.
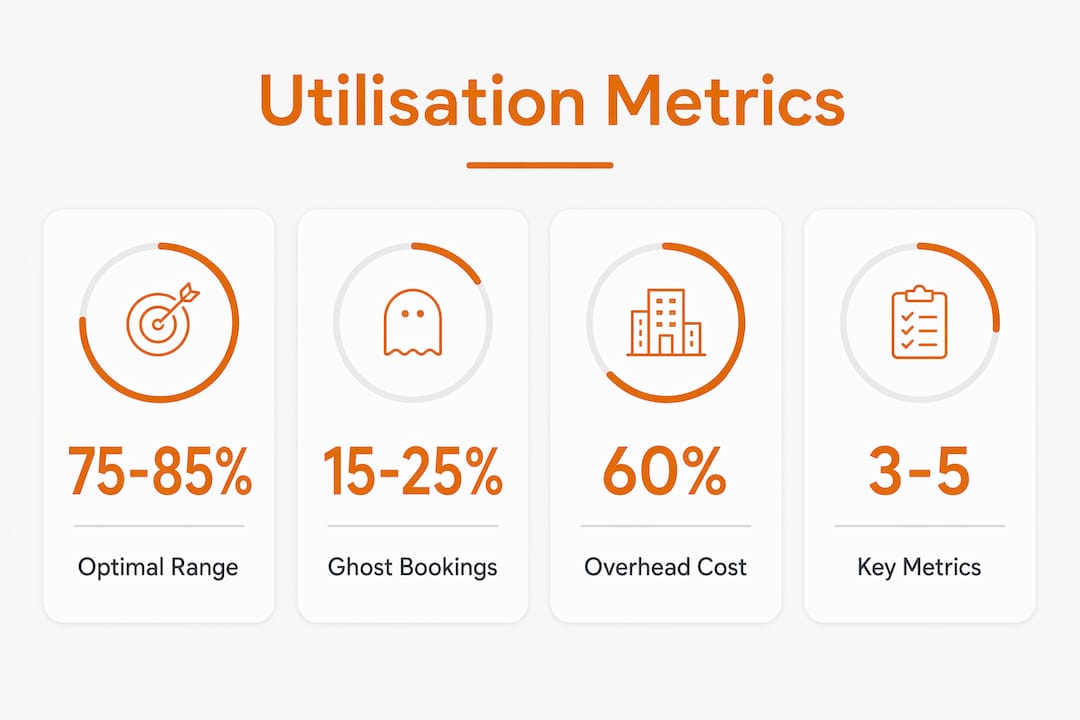
Booking software alone inflates utilisation by 15–25% because of ghost bookings. A ghost booking occurs when a room or desk is reserved but the occupant never arrives. The system logs it as used. Your data looks healthy. Your space is not.
The fix is to combine intentional data with passive data. Intentional data comes from reservation systems. Passive data sources include badge swipes, Wi-Fi device detection, and occupancy sensors. Together, they reconcile what people planned to do with what they actually did.
Pro Tip: Install QR code check-in at desks and meeting rooms. Require a scan to confirm occupancy. This single step removes ghost bookings from your data without requiring expensive sensor infrastructure.
Three metrics give a complete picture of workspace efficiency:
| Measurement method | Data source | Accuracy | Main limitation |
|---|---|---|---|
| Booking system only | Reservation software | Low | Ghost bookings inflate figures by 15–25% |
| Badge swipe data | Access control logs | Medium | Only captures entry, not desk-level use |
| Occupancy sensors | IoT hardware | High | Higher upfront cost |
| Combined approach | Reservations + sensors | Highest | Requires integration between systems |
Office occupancy is not flat across the week. Utilisation peaks on Tuesday through Thursday and drops noticeably on Mondays and Fridays. This pattern has become more pronounced since hybrid working became standard practice across UK offices.
| Day | Typical utilisation level |
|---|---|
| Monday | Low (60–70% of midweek peak) |
| Tuesday | High |
| Wednesday | High |
| Thursday | High |
| Friday | Low (50–65% of midweek peak) |
A utilisation rate below 75% signals that consolidation or subletting is worth investigating. A rate above 85% means you are approaching capacity stress. Neither extreme is sustainable. The 75–85% band is the target because it leaves enough buffer for natural variation without wasting resource.
Hybrid working has sharpened these contrasts. Many UK organisations now see midweek occupancy that exceeds pre-pandemic levels, while Monday and Friday occupancy has fallen. This creates a specific planning challenge: the office must be designed for Tuesday peak demand, not average weekly demand. Optimising your office for hybrid teams requires a layout that flexes across the week rather than one fixed configuration.
Pro Tip: Map your utilisation by day of the week for at least four consecutive weeks before making any layout decisions. Single-week snapshots are misleading. Four weeks reveals the real pattern.
Better space utilisation reduces costs directly and improves working conditions indirectly. Both outcomes matter to facility executives making the case for investment.
On the cost side, utilisation data prevents overbuilding by sizing spaces for typical peak demand rather than rare extremes. Organisations that right-size their real estate based on accurate utilisation data avoid committing to lease obligations that exceed genuine need. Given that overheads can reach 60% above base lease costs, even modest reductions in wasted space produce meaningful savings.
The indirect benefits are equally compelling:
Overutilisation carries its own costs. Crowded offices increase noise complaints, reduce focus time, and raise the risk of staff turnover. The utilisation rate is the earliest warning signal for both problems.
Improving workspace efficiency requires a combination of policy changes, technology, and physical reconfiguration. No single lever is sufficient on its own.
Pro Tip: Combine your reservation system data with at least one passive source before presenting utilisation figures to leadership. A single data source will always be challenged. Two corroborating sources are far harder to dispute.
For a structured approach to reconfiguring your floor plan, the office space planning guide from Furnitureforbusiness covers layout decisions that directly affect utilisation outcomes.
Accurate utilisation measurement, combined with the right physical layout, is the most direct path to reducing wasted office spend and improving working conditions.
| Point | Details |
|---|---|
| Target the 75–85% band | Rates below 75% signal wasted spend; above 85% risks overcrowding and staff dissatisfaction. |
| Correct for ghost bookings | Booking data alone overstates utilisation by 15–25%; always combine with passive data sources. |
| Plan for midweek peaks | Tuesday to Thursday drives the highest demand; design layouts for that reality, not weekly averages. |
| Use the space efficiency factor | Target a net-to-gross floor area ratio of approximately 0.75 to justify reconfiguration to leadership. |
| Align furniture to utilisation data | Modular, space-efficient furniture lets layouts adapt as occupancy patterns change over time. |
Most facility teams I speak with are measuring utilisation. Very few are measuring it accurately. The reliance on booking data is the single most common mistake, and it is an expensive one. When your reported rate is 80% but your actual rate is closer to 60%, every decision built on that number is wrong. Lease renewals, headcount planning, furniture procurement — all of it drifts off course.
The second mistake is treating utilisation as a static KPI rather than a dynamic planning lever. Organisations change. Teams grow, shrink, and shift to hybrid patterns. A utilisation figure from 18 months ago tells you almost nothing about today’s space needs. Continuous monitoring is not a luxury. It is the only way to keep your real estate decisions grounded in reality.
The metric I find most useful when presenting to senior leadership is the space efficiency factor: net usable floor area divided by gross floor area, with a target of approximately 0.75. It is concrete, it is comparable across buildings, and it gives executives a number they can act on. Pair it with a cost-per-square-foot breakdown that includes overheads, and the case for reconfiguration becomes very difficult to ignore.
The offices that get this right share one habit: they treat utilisation data as a weekly conversation, not an annual report.
— Furniture
Knowing your utilisation rate is the first step. Configuring your office to act on it is the next.
Furnitureforbusiness supplies commercial office furniture to UK businesses, with free delivery to the UK mainland. The range covers ergonomic office chairs designed for shared-desk environments, height-adjustable desks that support flexible working patterns, and meeting room furniture built for spaces that need to perform on high-occupancy days. Whether you are right-sizing a floor or reconfiguring for hybrid teams, Furnitureforbusiness offers bulk order pricing and easy returns to make the process straightforward.
Office space utilisation is the percentage of available workspace actively used during a given period, calculated by dividing actual usage by total capacity and multiplying by 100. The industry target for efficient use is 75–85%.
Divide the number of occupied workstations or spaces by the total available capacity, then multiply by 100. For accuracy, combine booking data with passive sources such as occupancy sensors or badge swipe records.
Ghost bookings, hybrid working patterns, and poor layout design are the three leading causes. Booking data alone overstates utilisation by 15–25%, masking the true extent of underuse.
A rate of 75–85% is the accepted benchmark for efficient office use. Below 75% indicates scope for consolidation or cost reduction; above 85% signals that the space is under pressure and may need expansion or reconfiguration.
Hybrid working concentrates occupancy on Tuesday through Thursday and reduces it significantly on Mondays and Fridays. Offices should be designed and furnished for midweek peak demand, with flexible layouts that adapt to lower occupancy at the start and end of the week.

Phone: 0330 043 4114
VAT no. GB 991 8681 60
Company no. 07250570